Section 3: Fundamental of Audio Processing
3.1 Audio Processing
audio signals의 종류는 굉장히 다양하다.
-
Speech
사람에 의해 articulate된 sounds이다. socially meaningful하며, 보통 생각이나 감정을 표현한다.
-
Not from humans
car engine sounds, musical instruments, animal sounds 등
-
Not from articulatory organs
clapping, fart 등
-
Not socially meaningful
coughs, snoring, sneezing, hiccups 등
3.1.1 utterance
utterance란 speech signal의 audio clip을 의미한다. 따라서 다양한 attributes를 가지고 있다. 아래는 대표적인 attributes 예시다.
-
speaker
-
language
-
transcript/phrase
3.1.2 generation of sounds
sound는 매질(gas, liquid, solid 등)을 통해 전파되는 acoustic wave(vibration)이다.

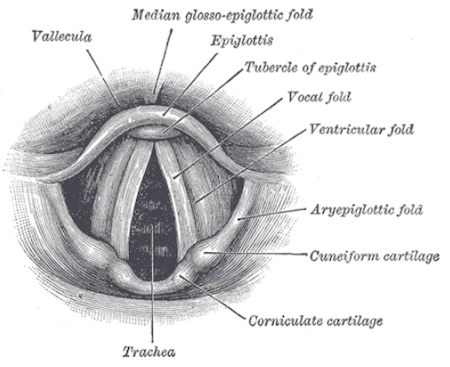
3.1.3 generation of speech
speech는 vocal organs에 의해 만들어진다.
-
vocal folds(성대): vibrate
-
glottis(성문): air flow를 조절
-
vocal tract(성도): sound를 modulate
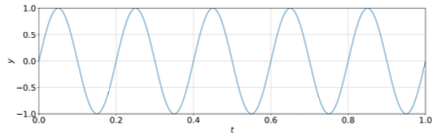
3.1.4 Sine wave
복잡한 sound waveform을 분석하기 앞서, 기본이 되는 sine wave(sinusoid)에 대해 알아보자.
, ,
-
: amplitude
-
: frequency
-
: angular frequency
-
: period
-
: phase
3.1.5 Fourier analysis
Fourier analysis는 복잡한 signal을 여러개의 sine, cosine wave의 합으로 분해한다.
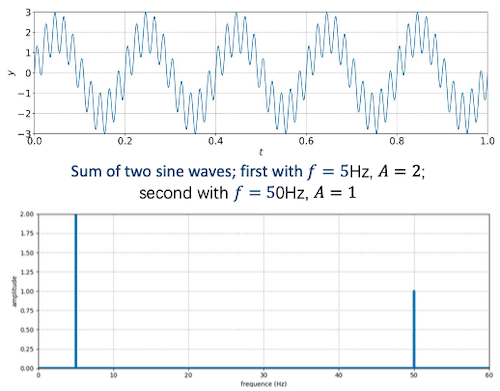
3.1.6 Spectrum
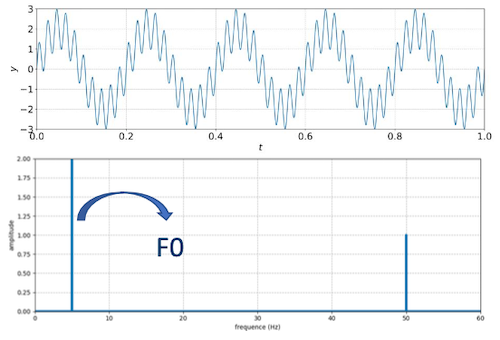
Fourier analysis를 이용하면 sound wave를 spectrum으로 시각화할 수 있다.
다음은 두 개의 sine wave( , / , )를 합친 signal을, Fourier analysis를 적용하여 얻어낸 spectrum이다.
-
x축: sine wave component의 frequency
-
y축: sine wave component의 amplitude
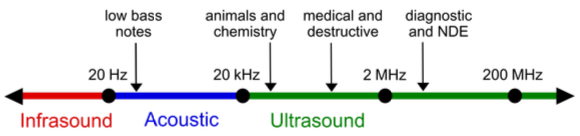
3.2 Frequancy of sound
마치 빛의 electromagnetic spectrum(radio → microwave → infrared → visible → ultraviolet → X-ray)처럼, sound도 frequency에 따라 여러 종류로 나뉜다.
-
Acoustic
사람은 20Hz ~ 20kHz frequency를 가진 sound를 들을 수 있다.
3.2.1 Fundamental frequency and pitch
-
fundamental frequency(F0)
-
Generic signal: lowest frequency를 갖는 component를 의미한다.
-
Speech: vocal fold vibration에서의 frequency를 의미한다.
-
-
pitch
F0에 대한 사람의 perception이다.
-
시간에 따른 F0 변화는 'pitch track'으로 표현한다.
예를 들면 노래방에서 볼 수 있는 memody line이 이에 해당된다.
-
3.2.2 formant
formant(포먼트)란 resonance(공명)이 일어나는 특정 frequency를 의미한다.
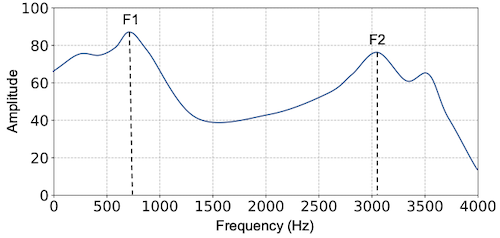
- 사람의 formant에서 첫 번째와 두 번째 formant를 F1, F2로 지칭한다.
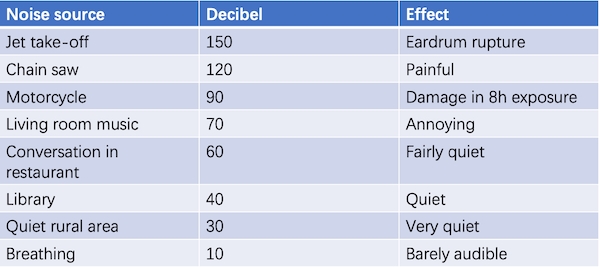
3.2.3 intensity and loudness
intensity란 signal의 power에 대응되는 개념이다. 예를 들어 주기(period) 를 갖는 signal 가 있다고 하자.
Power는 다음과 같이 정의된다.
하지만 소리의 크기를 전력, 전압을 통해 다루는 것은 불편하고 복잡하기 때문에, 상대적인 비교값에 해당되는 intensity를 정의하여 사용한다.
intensity는 Power와 Power의 Auditory threshold 를 이용하여 intensity를 정의할 수 있다. 단위는 decibel(dB)를 사용한다.
간혹 intensity를 power 대신 sound pressure를 바탕으로 정의하기도 한다. 이 경우 intensity는 다음과 같이 정의된다.
-
: 측정한 sound pressure의 root mean square
-
: standard reference sound pressure (20 micropascals)
loudness는 intensity에 대한 사람의 perception이다.
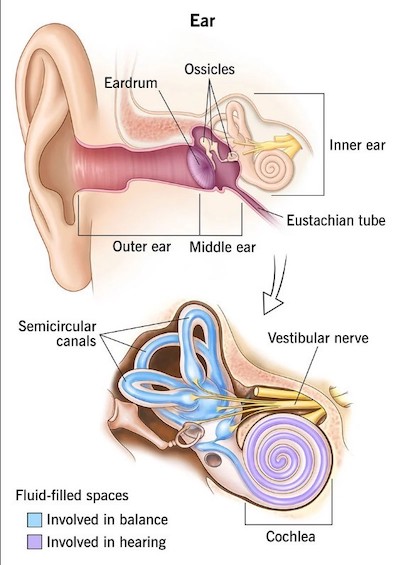
3.3 Nonlinearity of human hearing
사람의 귀는 nonlinear하다.
-
ear canal(외이도)
resonant frequancies를 가지며, 몇몇 frequency를 amplifiy/attenuate한다.
-
ossicles(귓속뼈, 청소골)
특정 intensity range에서 linear하게 작동하며, 이외의 범위에서는 inner ear를 지키기 위해 nonlinear하게 작동한다.
-
cochlea(달팽이관, 와우)
여러 위치의 hair cells(유모세포)가 각자 다른 frequencies를 감지한다.
이러한 특징 때문에 사람이 인식하는 sound는 logarithm distribution에 가깝다.
nonlinearity는 두 가지 관점에서 설명할 수 있다.
-
Nonlinearity of frequency
-
Nonlinearity of intensity
3.3.1 Nonlinearity of frequency: Bark scale
1961년 제안된 Bark scale은 사람의 hearing range를 고려하여 24개의 frequency band로 나눈 scale을 의미한다.
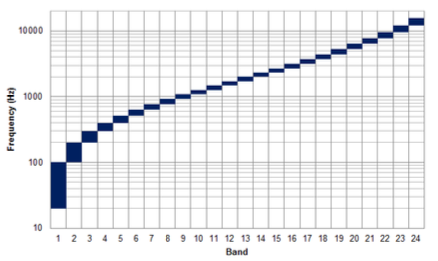
-
500Hz 이하에서는 linear 형태를 갖는다.
-
500Hz를 넘어가면 logarithmic 형태를 갖는다.
frequency를 Bark scale로 approximation하는 식은 다음과 같다.
3.3.2 Nonlinearity of frequency: Mel scale
Mel scale도 마찬가지로 사람의 hearing range를 고려하여 제안된 scale로, Bark scale과 다르게 continuous하다는 특징을 갖는다.
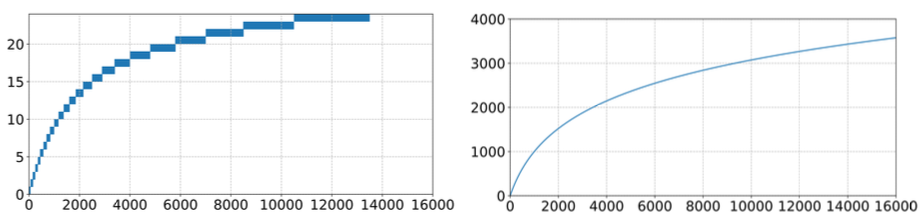
- 좌측: Bark scale, 우측: Mel scale
Mel: Melody에서 유래
에서 frequency conversion은 다음과 같다.
3.3.3 Nonlinearity of frequency: other scales
이외 다음과 같은 scale들이 제안되었다.
- Equivalent Rectangular Bandwidth(ERB) scale
- Cochlear frequency-position function scale (Greenwood scale)
3.3.4 Nonlinearity of intensity
사람은 smaller amplitude(진폭)을 갖는 signal에 더 민감하다.